How to analyze open-ended survey responses (without reading all 500)
Hundreds of comments and a deadline. Here’s how to make sense of them without reading every one.
What you’ll learn
- Five ways to analyze free-text answers, and what each costs
- Why word clouds and sentiment scores mislead
- How to check an AI summary before you trust it
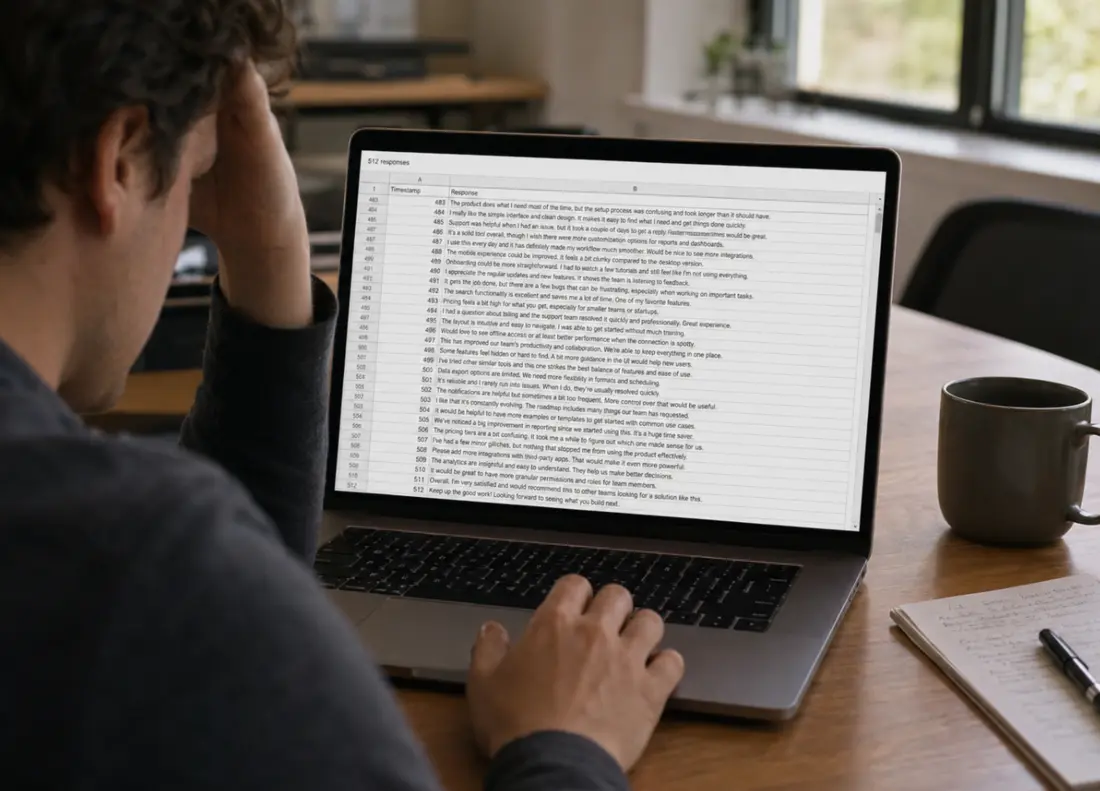
It is Thursday. The survey closed on Monday, the multiple-choice results charted themselves in an afternoon, and the readout to leadership is next week. Between you and a finished deck sits column B: 512 rows of free text. Some of it is two words. Some of it is four paragraphs. All of it was written by people who had something to tell you.
Those people are rarer than they look. In a 2021 Pew Research Center analysis, open-ended questions averaged around 18 percent item nonresponse, against 1 to 2 percent for closed questions. Typing an answer in your own words takes effort most respondents decline, so the ones who did it anyway are your most invested respondents by a wide margin. What usually happens to their effort is grim: someone skims the first hundred rows, lifts the three most vivid quotes, and the deck ships. There is a better way through the pile that does not require pretending you will read all 500. There are really only five methods, and they produce different things. The right one depends on a decision most teams never make explicitly.
# Decide what the deliverable is, then pick the method
“Analyze the comments” is a task nobody can finish, because it names no deliverable. Every open-ended analysis actually produces one of four artifacts. Decide which one the meeting needs and the method mostly picks itself.
- A ranked list of themes, with counts
- For prioritizing. What should we fix first, and how many people asked for it. Coding and clustering produce this.
- Representative quotes
- For persuading. The verbatim sentences that make a finding land in a room. These come from reading, and from choosing for representativeness over vividness.
- One readable synthesis
- For deciding. A paragraph that answers the question the way the group would if it could speak together. Summarization produces this, human or AI.
- A running pulse
- For listening over time. The same question asked continuously, with a dated trail of what the answer was each week. This one constrains how you collect, not just how you analyze.
# Thematic coding is the gold standard. You will not do it weekly
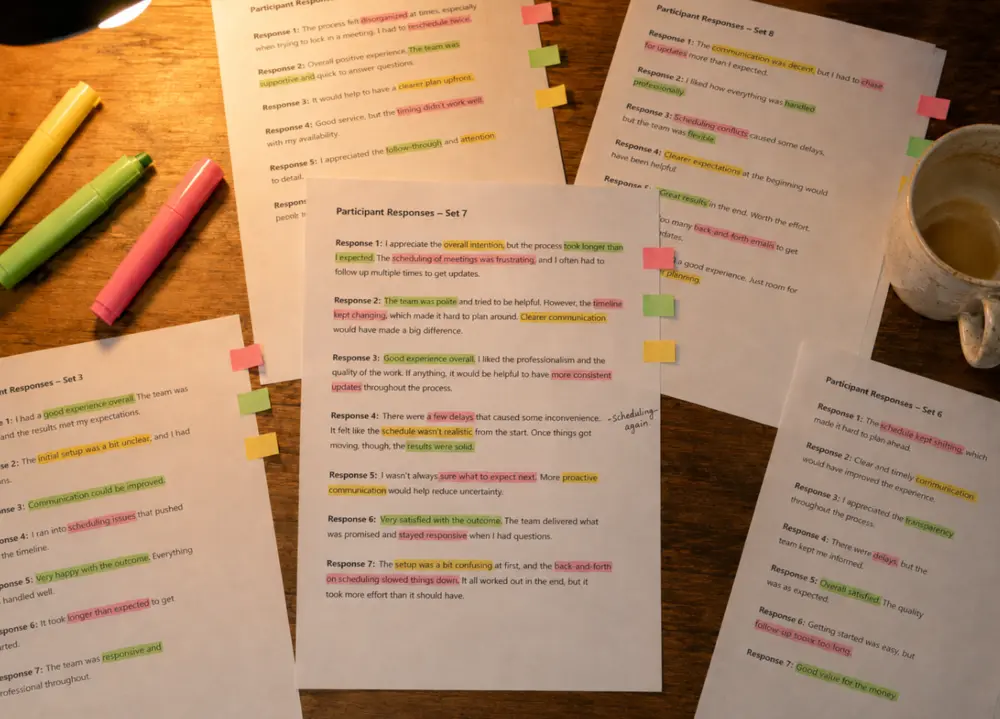
The rigorous version of reading everything has a name and a literature. Braun and Clarke’s 2006 paper “Using thematic analysis in psychology,” the standard reference and one of the most cited method papers in any field, breaks the work into phases: read for familiarity, tag each response with short codes, collect the codes into candidate themes, then review, define, and write up. Its virtue is that nothing stands between you and the data. Every theme in your report is there because it kept showing up in sentences you can quote, and when someone in the readout asks “says who?”, you open the spreadsheet and show them.
Now the arithmetic. Tagging 500 responses at thirty seconds apiece is more than four hours, and that is the first pass of a method that assumes several. The spend is right for surveys that decide expensive things: the annual engagement survey, a churn study, research you will publish. For a weekly pulse it is fantasy, and the gap between “we should code these properly” and the four hours nobody actually has is exactly where comment fields go to die. So budget coding for the surveys that earn it, and have a cheaper plan for the rest. The next three methods are the candidates.
# Word clouds: a hint about vocabulary, not a finding
The oldest shortcut counts words and sizes them by frequency, which is the whole trick. It takes seconds, and once in a while it surfaces a term you did not expect to see at all. That is more or less the entire upside. “Communication” in forty-point type confirms a suspicion you had before the survey ran, while the diagnosis, who cannot talk to whom and about what, sat in the surrounding words the cloud threw away. Phrasing splits themes too: “too many meetings,” “pointless meetings,” and “meeting overload” render as three small words instead of one big one, so the loudest word in the cloud is often just the most uniformly phrased.
Use a frequency pass to decide where to start reading if you like. We have covered this failure mode, and the tools that handle open text better, at length in the word cloud pieces linked at the end.
# Sentiment scores: a smoke alarm, not a diagnosis
Survey platforms now score every comment positive, negative, or neutral by default, and as a trend line the score earns its keep. If the negative share of comments doubles quarter over quarter, something happened, and the alarm went off without anyone reading a word.
Trust it no further than that. Short, informal text is where sentiment models are weakest, and sarcasm flips meaning in ways scoring cannot see. “Great, another reorg” is not positive feedback, but it scores like it is. A 2025 study by Naman Bhargava and colleagues found the degradation persists even in current LLM-based classifiers once sarcasm and paraphrase enter the text. A smoke alarm tells you there is smoke. Someone still has to go find the fire, and the fire is in the sentences.
# AI topic clustering: the new default, and it needs an editor
The current standard in survey tooling is AI-assisted topic grouping: the platform reads the responses, proposes labelled topics, counts the responses under each, and often attaches per-topic sentiment. Qualtrics’ Text iQ documentation shows the mature version of the pattern, automatic topic recommendations, hierarchies for related topics, sentiment isolated to the matching part of each response. Mentimeter, Slido, and Vevox ship lighter takes on the same idea for live audiences.
Clustering genuinely solves the volume problem. It produces the ranked-list-with-counts artifact at any scale, and the clusters stay auditable, since you can open one and read what the machine put inside. A couple of edits make the output trustworthy. Rename the labels: machines generate topics like “Communication” and “Process,” and a label only becomes a finding when a human sharpens it into a claim, like “status updates arrive too late to act on.” And sample each cluster before quoting its size, because the count is only as good as the boundary, and boundaries drift.
# AI synthesis: the answer itself, if you keep the receipts
The newest method hands the whole pile to a language model and asks for the deliverable directly: read everything, write what the group is saying. Out comes the paragraph a diligent analyst would have written after the four hours, in seconds, and it preserves the thing Qualtrics’ guide to open-ended questions identifies as the format’s entire value: the why, in people’s own words, from a format that resists being counted.
A synthesis is a claim, and language models produce fluent claims on thin support without blushing. Two habits keep it defensible. Spot-check every assertion in the summary against the raw rows before it ships. And keep the responses attached to the summary wherever it travels, so anyone can trace how the reading was reached. A synthesis with its sources underneath is an analysis. Without them it is a rumor.
# The five methods, one table
Different trades of effort against fidelity, producing different artifacts. The short version:
| Method | Effort | What you get | Where it breaks |
|---|---|---|---|
| Thematic coding | Hours to days | Defensible themes with counts and quotes | Does not scale; nobody codes the weekly pulse |
| Word frequency / clouds | Seconds | A hint about vocabulary | Frequency is not importance; context is discarded |
| Sentiment scoring | Seconds | A temperature trend line | Sarcasm and short text; never explains why |
| AI topic clustering | Minutes | Ranked topics with counts, auditable | Generic labels; counts depend on boundaries |
| AI synthesis | Seconds | One readable answer in the group’s words | Must be spot-checked against the raw responses |
# The workflow: twenty raw, then automate, then verify
In practice the methods stack, and the stacking matters more than the choice. Start with what we would call the twenty-response rule: before any tool touches the data, read twenty or thirty responses drawn at random. Ten minutes. This is calibration, and it is the cheapest quality control in the whole process, because once you have seen the ground truth you will notice when a cluster label or a summary sentence is off. Then run the automated pass, clustering or synthesis or both, to cover the volume you cannot read. Then verify in the one direction tools cannot: take each theme headed for the deck back to the raw text and confirm it is there, plainly, in more than one person’s words.
Report all three layers together, the counts, two or three quotes, and the one-paragraph synthesis, so the deck carries its own evidence. And choose those quotes with discipline. One furious, articulate comment is one respondent, and it will dominate every room it is read in. The comment that shows up forty times in plainer clothes is the finding.
Read twenty before the tools run. Re-read the raw text before any theme goes in the deck.
# When the question never closes
Everything above assumes a batch: collect for two weeks, export, analyze, present. The fourth deliverable from the top of this article, the running pulse, refuses that shape. If the question never closes, analysis as a one-off project never fits it, and the reading has to happen while the answers arrive.
That standing-question case is what OneVoicer is built for. One open-ended question lives at a link or QR code, and every response folds into a single written answer that re-forms as new voices land, with each individual response kept underneath it, the receipts from the synthesis section, attached by default. Record and reset turns the standing question into the pulse artifact directly: on a daily or weekly schedule the current blend is saved to a dated history and the voices reset, so a month of listening reads as four dated paragraphs rather than an export nobody scheduled time to code. Code the annual survey. Let the weekly question synthesize itself.
# Try it on your last survey’s comment field
One afternoon, one export, and you will know which method your situation actually needs.
- Export the open-ended column Pull the free-text responses into one place, one row per response, and note the count. Under about fifty, skip the tooling entirely and read them with three highlighter colors.
- Read twenty at random Before any tool runs, read a random sample and jot down the two or three themes you noticed. This is the calibration set you will judge every tool output against.
- Run one automated pass Use whatever your platform offers, topic clustering or an AI summary, and lay its output beside your notes. Where they agree you have a finding. Where they disagree, read that cluster raw.
- Verify before you report For every theme that will appear in the deck, find at least three raw responses that state it plainly. Ship the count, the quotes, and the synthesis together.
# Frequently asked
How many responses before AI analysis is worth it over just reading?
Under about fifty, reading is faster than configuring anything, so read. Between fifty and a few hundred, clustering or synthesis saves real hours while your twenty-response calibration sample still covers a meaningful slice of the data. Past a few hundred, tooling is the only way every response gets read at all, and the verification step matters more, not less.
Can I trust an AI summary of survey responses?
The way you would trust a junior analyst’s first draft: plausibly right, and checked before it ships. Spot-check each claim against raw responses, and keep the full response list attached wherever the summary goes. A verified synthesis is an analysis; an unverified one is a confident paragraph.
How long does manual thematic coding actually take?
Budget thirty seconds to a minute per response for the first pass, so 500 responses runs four to eight hours before theme review, and Braun and Clarke’s method assumes more than one pass. It is the right spend for high-stakes surveys and the wrong one for a weekly pulse.
Is it safe to paste survey responses into an AI tool?
Treat responses as personal data even when the survey was anonymous, because people identify themselves in free text more often than you would expect. Strip names and emails before analysis, use a tool whose data-retention terms you have actually read, and if the survey promised confidentiality, make sure the analysis path keeps the promise.
What is thematic analysis in plain terms?
Reading every response, tagging each with short labels for what it says, and promoting the labels that keep recurring into themes. Braun and Clarke formalized it in 2006. The discipline it adds over casual reading: a theme earns its place by recurring in the data, never by being memorable.
# References
- Braun, V. and Clarke, V., “Using thematic analysis in psychology,” Qualitative Research in Psychology (2006) · the standard reference for thematic coding and its phases
- Pew Research Center, “Writing Survey Questions” · closed questions capture what respondents chose; open-ended questions capture the why, in their own words
- Dorene Asare-Marfo, “Why do some open-ended survey questions result in higher item nonresponse rates than others?”, Pew Research Center Decoded (2021) · open-ended items average around 18% nonresponse versus 1–2% for closed items
- Qualtrics, “A Quick Guide to Open-Ended Questions in Surveys” · open responses capture feedback in respondents’ own words but are difficult to quantify
- Qualtrics, “Text iQ Best Practices” · AI-assisted topic building, topic hierarchies, and topic-level sentiment for open-text analysis
- Bhargava, N. et al., “On the Impact of Language Nuances on Sentiment Analysis with Large Language Models: Paraphrasing, Sarcasm, and Emojis” (2025) · sentiment classifiers, including LLM-based ones, degrade on sarcasm and paraphrase